Hook
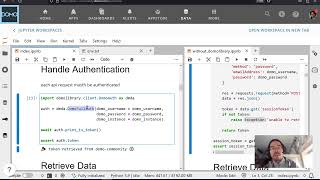
When a Magic ETL dataflow is slow, the bottleneck usually isn't where you think it is — and without execution history data, you're guessing. This post walks through how to use Python and DomoLibrary to programmatically surface which tiles are slow and, more importantly, why.
Why It Matters
Knowing a dataflow is slow is easy. Knowing which tile is slow is harder. Knowing whether that tile is slow because of its own logic or because it's waiting on a slow parent tile is harder still. Without querying execution history across runs, you can't distinguish between a tile that's genuinely expensive and one that's just downstream of a problem. This approach lets you build a dataset that answers that question at scale — across every dataflow in your Domo instance.
What You'll Learn
- Query Domo's dataflow execution history API to retrieve per-tile run durations
- Traverse tile dependency graphs to identify parent-child relationships in Magic ETL
- Differentiate between tile self-cost and inherited latency from upstream parents
- Extend DomoLibrary's
DomoDataflowclass with new methods for versioning and history retrieval - Build a reusable dataset that ranks tiles by performance impact across multiple executions
Querying Tile Dependencies and Execution History in DomoLibrary
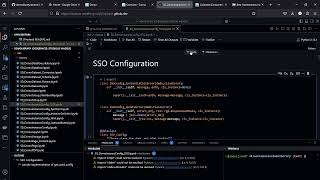
The core challenge here is that Magic ETL tiles aren't linear — a single tile can have multiple parents, and the depends_on list reflects that graph structure. DomoLibrary's get_dataflow_by_id already returns action metadata including those dependency lists; the new work in this tutorial adds execution history retrieval on top of that.
The workflow breaks into three layers. First, you pull the current dataflow state to get tile IDs and their declared parent relationships. Second, you query execution history to get per-run, per-tile timing data — this is where the additional API calls come in. Third, you join those two datasets so that for each tile, you can see both how long it ran and how long each of its parents ran in the same execution.
The key insight the video surfaces: a tile that looks slow in isolation might be spending most of its wall-clock time waiting for an upstream parent to finish. Until you can see both numbers side by side, you can't tell the difference. The Python code builds that joined view, letting you sort tiles by their own execution time separately from their dependency-imposed wait time.
The pattern here — extend a library class with history and versioning endpoints, then join metadata to execution records — is directly reusable for other Domo object types that expose similar API surfaces (DataSets, Beast Modes, etc.). The notebook linked in the description is the starting point for adapting it.